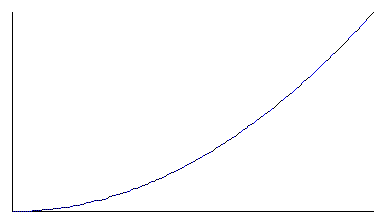
The following graph is for the elastic potential energy of a spring. The y-axis represents the potential energy of the spring, and the x-axis represents the distance that the spring is compressed.

Choose the sentence that is the best interpretation of the graph:
Questions about the test? Send e-mail to: sahyun@physics.orst.edu
Last modified October 20, 1997.