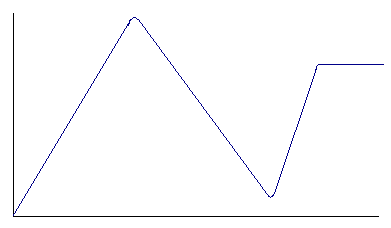
This is a graph of an object's motion. The y-axis represents the object's velocity, and the x-axis represents time.

Locate the part of the graph when the acceleration is greatest.
Questions about the test? Send e-mail to: sahyun@physics.orst.edu
Last modified October 20, 1997.