Representing Motion on Speed-Time Graphs – Question 3
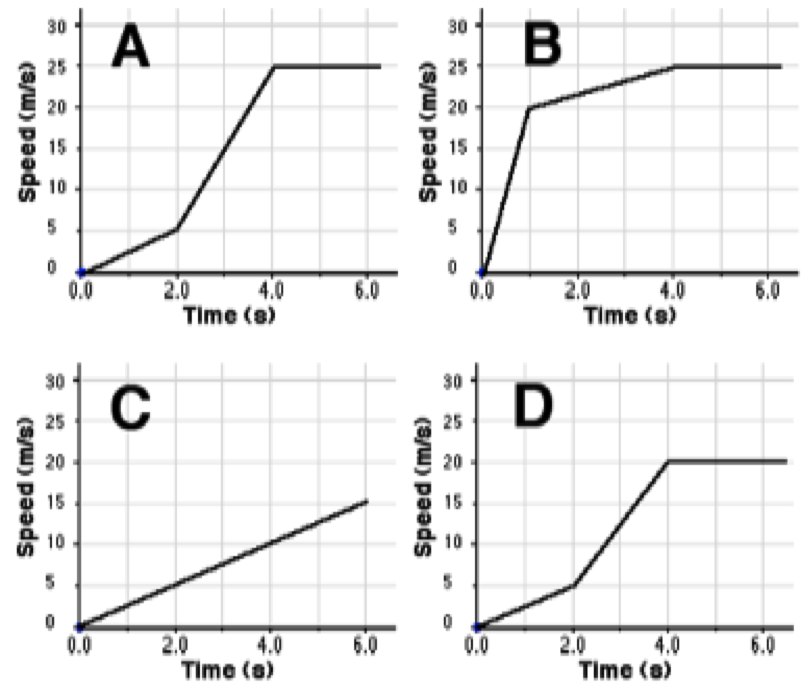
Below are four graphs representing possible motions of a car over a 6-second period.
(A) low slope, large slope, flat, (B) large slope, low slope, flat, (C) constant moderate slope, (D) low, moderate, flat
Transcript / Long description
Four graphs representing possible motions of a car over a 6-sec period.
For which graph does the car have the greatest speed at 3 seconds?
For which graph does the car have the greatest rate of change of speed around 3 seconds?