Representing Motion on Speed-Time Graphs – Question 2
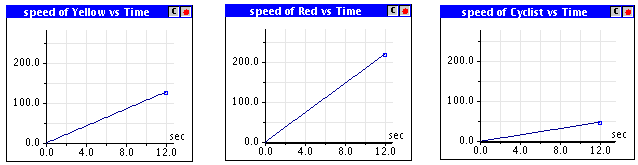
Notice that the three speed-time graphs have different slopes. The slope of the line on the speed-time graph equals the rate of change of speed.
Notice that the three speed-time graphs have different slopes. The slope of the line on the speed-time graph equals the rate of change of speed.